
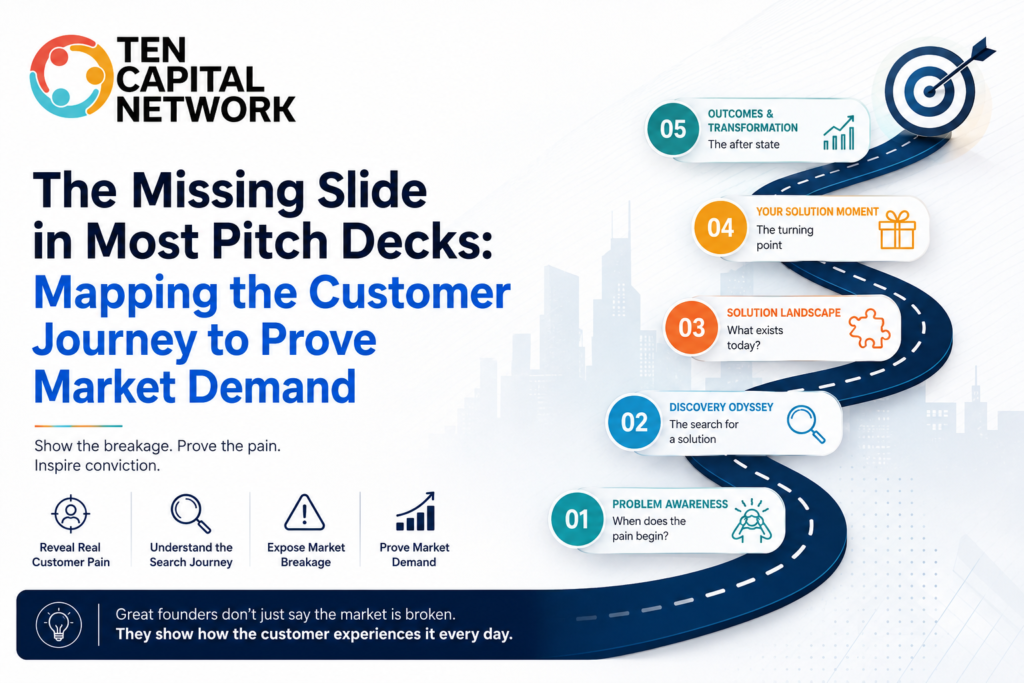
The Missing Slide in Most Pitch Decks: Mapping the Customer Journey to Prove Market Demand
6 min read The Missing Slide in Most Pitch Decks: Mapping the Customer Journey to Prove Market Demand Most startup pitch decks spend too much time talking about the product and not enough time explaining the customer’s pain. Founders often assume investors will automatically understand the urgency of the problem. They won’t. Investors see hundreds of companies claiming to solve “massive inefficiencies” every year. What separates a compelling pitch from a forgettable one is the ability to show the lived reality of the customer. That’s where customer journey mapping becomes one of the most powerful storytelling tools in a startup pitch deck. A well-constructed customer journey slide does more than explain user behavior. It demonstrates friction, wasted time, emotional burden, operational inefficiency, and the hidden costs of unmet need. It transforms your startup from “interesting software” into a necessary market solution. The best founders don’t simply say the market is broken. They show the audience exactly how the customer experiences the breakage every day. Why Investors Care About the Customer Journey Investors are not just evaluating whether your product works. They are evaluating: Whether the pain is severe enough to drive purchasing behavior Whether existing solutions are inadequate Whether the market inefficiency is large enough to support venture-scale returns Whether customers are actively searching for alternatives Whether the timing is right for disruption A customer journey narrative answers all five questions simultaneously. When done properly, it creates emotional and analytical conviction. Instead of saying: “The procurement process is inefficient.” You show: A CFO spending 14 months evaluating vendors Operations teams manually stitching together spreadsheets Employees duplicating work across systems Compliance failures due to fragmented workflows Rising labor costs from inefficient tooling Burnout from operational chaos Now the investor feels the pain instead of merely hearing about it. That difference matters. Stage 1: Problem Awareness — When Does the Pain Begin? Every meaningful startup opportunity begins long before the customer buys software. The pain usually starts quietly. A missed report. A failed audit. A delayed customer response. An operational bottleneck. An unexpected financial loss. The most effective pitch decks identify the exact trigger moment when the customer first recognizes the problem. This stage matters because it demonstrates urgency. Questions to answer in your deck: What event causes the customer to notice the issue? How frequently does it occur? Who experiences the pain first? How long do they tolerate it before acting? What are the hidden costs of delay? For example: “Mid-market manufacturers typically experience inventory forecasting failures for 12–18 months before actively seeking a solution. During that period, excess inventory costs rise 8–12%, while production delays increase customer churn.” That statement communicates duration, financial impact, and behavioral timing. Investors immediately understand the market inefficiency. You are not just selling software anymore. You are quantifying unresolved pain. Stage 2: Discovery Odyssey — The Search for a Solution Most customers do not discover your company immediately. In fact, the complexity of their search is often evidence of market dysfunction. This is one of the most underused sections in startup storytelling. Map the customer’s “discovery odyssey” by showing: How many vendors they evaluate How many channels they search through How long the buying process takes Which departments become involved What causes confusion or abandonment This section demonstrates friction within the existing ecosystem. For example: Stage Customer Experience Initial Search Google, peer referrals, consultants Vendor Research 8–12 platforms evaluated Internal Alignment IT, finance, operations, compliance reviews Trial & Testing Multiple pilots fail integration requirements Decision Delay Procurement cycle extends 9–14 months Now the investor sees something important: The customer is actively trying to solve the problem — but the market is failing them. That distinction is critical. A weak market is one where customers do not care. A massive startup opportunity is one where customers desperately search for answers but cannot find a satisfactory solution. That’s the difference between inconvenience and unmet demand. Stage 3: Solution Landscape — What Exists Today? This is where most founders make a major mistake. They create a competitor matrix filled with checkmarks. Investors rarely care. Instead, explain why current solutions structurally fail. Focus less on features and more on systemic shortcomings. What investors want to know is: Why hasn’t this problem already been solved? Why do customers remain dissatisfied? Why are incumbents vulnerable? Why is now the right time for disruption? A better approach is to categorize the current landscape by compromise. For example: Existing Option Core Weakness Legacy Enterprise Software Expensive, slow implementation Point Solutions Fragmented workflows Consultants High recurring labor costs Internal Spreadsheets Human error and scalability limits Outsourcing Providers Lack of visibility and control This framing is powerful because it demonstrates that customers are already spending money — just inefficiently. That’s a key venture insight. Markets become enormous when spending already exists but value delivery remains poor. You are not creating demand from scratch. You are reallocating inefficient spend. Stage 4: A Day in the Life — Show the Human Burden This is the emotional center of the pitch. Great founders understand that operational pain creates emotional pain. A strong “day in the life” section illustrates the downstream consequences of the problem across the organization. Do not merely discuss workflow inefficiency. Show: Stress Delays Reputation risk Employee burnout Team conflict Customer dissatisfaction Financial uncertainty For example: “The VP of Operations starts every Monday reconciling inconsistent data from six disconnected systems. Finance disputes inventory counts. Customer success teams escalate delayed shipments. Executives spend weekly leadership meetings debating which dashboard is accurate.” That narrative communicates operational fragmentation far more effectively than a chart. You can also quantify the annual burden: Hours wasted annually Revenue leakage Compliance penalties Employee turnover Customer churn Delayed strategic initiatives This is where investors begin visualizing the magnitude of the market opportunity. Because large markets are often created by cumulative inefficiencies that appear small individually but become enormous at scale. Stage 5: The Gaps That Matter Now that the audience understands the customer’s struggle, explain what still remains unresolved — even after existing